Prediction of Rental Prices in Seattle using Craigslist Data
Business Case
The market for home rentals in Seattle is very dynamic. The rental prices have varied significantly from year to year the last few years (5% last year).
The prices for rentals are relevant to many stakeholders such as:
- Landlords and Tenants: trying to figure out the fair market price for properties
- The City: in evaluating the low-income thresholds and allocating budget to low income resident services and other city planning.
- Prospective home owners evaluating the net present value of buying versus renting.
These stakeholders make important decisions based on their understanding of the rental market and they would benefit from having a model that can be easily updated,
The Data
The data was collected from Craigslist. Craigslist is a very popular site for rental classifieds and I assumed that it is representative for the rental market in Seattle.
The data was scraped using Beautiful Soup. I obtained 3000 listings, which included features information such as number of bedrooms, bathrooms, area, dog allowed, cat allowed, w/d in unit, laundry in building, carport, and garage. If an address was includeed, it was colleted. If a map was included the latitude and longitude were collected. The geographical data ws used in conjunction with the google maps API to estimate the zip code for the listings. The number of images in the listing also was recorded.
The data was cleaned to delete duplicates, listings without price and outliers.
The top three zipcodes in terms of numbers of listings were converted in features, 0 or 1 for each zip code.
The final set contained 1742 listings, with an average price of $1874/month and price range of $600 to $6995/month. The mean listing included 1.5 bedrooms and 1.3 bathrooms.
The model
Several linear regression models were compared. A model was selected based on the higher cross-validated adjusted R2.
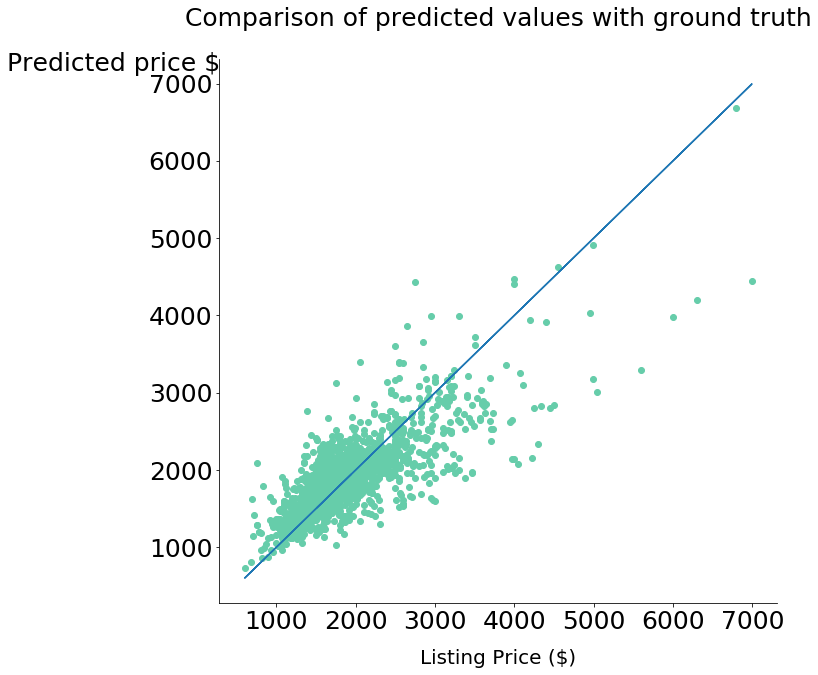
The model selected was a polynomial grade 2 model, which was estimated using LassoCV. The input variables were normalized. Its cross-validated adjusted R2 was 0.6 and the mean error was 15%.
The errors show a conical shape. Therefore, there may be other solutions outside the linear regression space that could yield a better result.

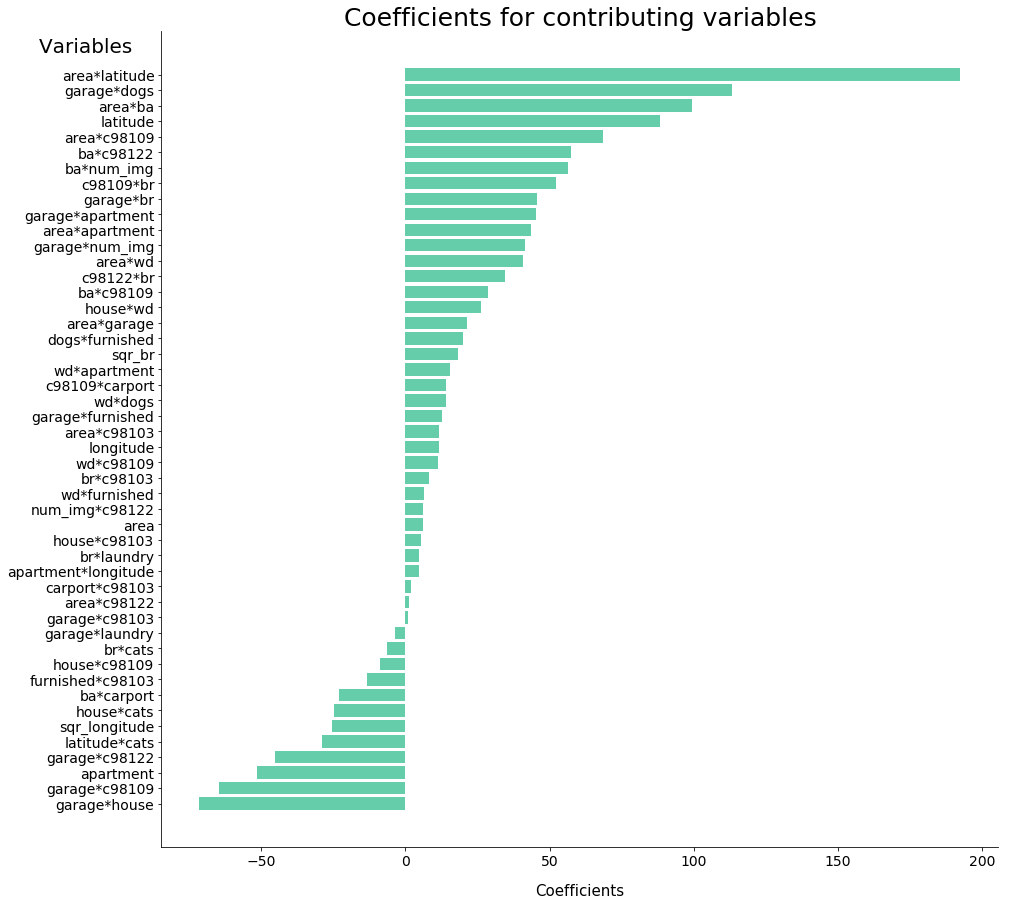
The relative effect of the variables in the final price can be examined by looking at the coefficients of the linear regression, because the variables were normalized. Thus, there are a lot of insights that could be drawn from the relative value of the regression coefficients.

For example, a person looking for an apartment with a limited budget could see from the chart, that he or she would be able to have a larger appartment south of Seattle or a smaller apartment north of Seattle.
Also, a landlord’s decision wheather acepting dogs or cats in the properting would be better informed by examining the incremental impact of rent by modifiying the pet poicy.
There are a few variables such as housegarage that could be a function of distance to downtown or other variable not included in the dataset.
Conclusions
We all have been in apartments with similar number of bedrooms and bathrooms, area, etc., but very different conditions. Variables such as new carpet, hardwood floors, new appliances, etc. are not included in the model.
Still, the model selected explains 60% of the variation of the price and the mean error is about 15%. The model is very simple and easy to implement and considered acceptable given the few features included.
Future Work
Inclusion of additional zip code data, and distance to downtown.