Classification of start-ups
Business Case The classification of startups into likely to be acquired or have an IPO is important, because these events mark the moment that stakeholders can cash out their equity interests.
The typical stakeholders for start-ups are: investors, employees and entrepreneurs.
The Data: The data used was the Published CPI by US Bureau of Labor Statistics and a Crunchbase dataset including data up to 2013.
The data set was cleaned to delete duplicates, and the model only considered companies that were at least 5 years old. The final data set included 8048 companies, which 12.3% were acquired and 2.4% went IPO.
Model Evaluation: Two models were developed. One model for likely to be acquired and one model for likely to have an IPO.
The algorithms evaluated for these models were:
- Logistic regression
- Random Forest
- Gradient Boosting
- Support Vector Machine
- Naïve Bayes
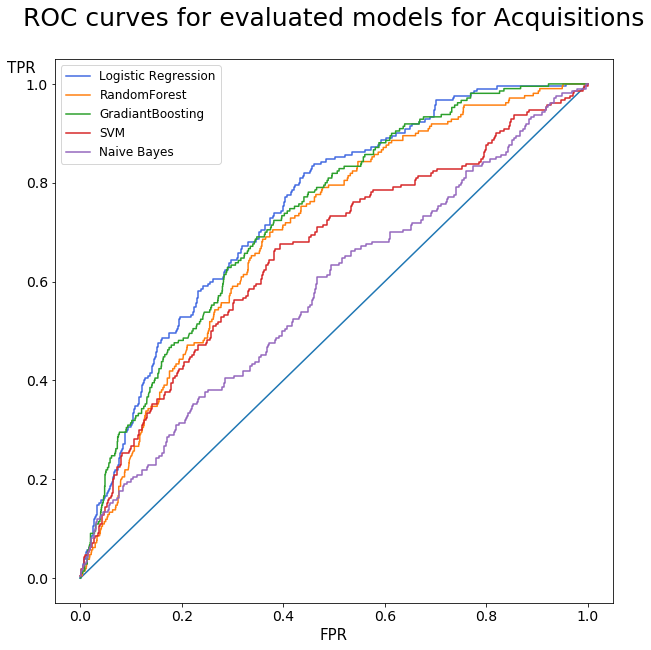
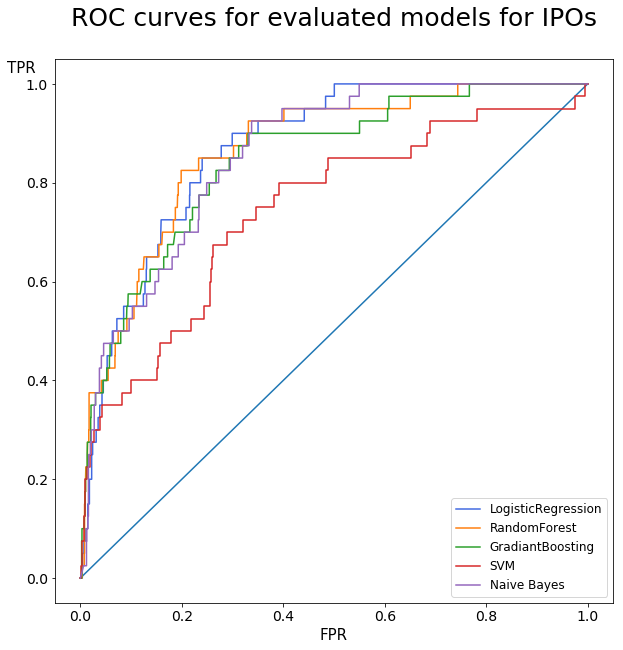
A grid search with cross validation was used for all the algorithms to optimize their parameters. The metric used for model selection was area under the ROC curve (AUC), because the data set was very unbalanced.
The features considered were: • Average annual inflation the year the company was founded • Month founded • Company category • State founded • Inflation adjusted raised amounts from crowdfunding and angel investors • Time (days) in operation at the time first founding was raised
Annual inflation was included as a feature, because it is a lead indicator to interest rate and interest rate is closely related to expected ROI from investor. In addition, it gives an indication of the rate of increase of prices and how effectively could entrepreneurs utilize the funds raised.


The models with the highest AUC value were based on logistic regression with L1 regularization for both categories. The AUC values for the train and test case for the logistic regression are within 2%, thus I considered that the models are not overfitting.
Results: The threshold for classification was determined by maximizing precision. Precision was selected to be the parameter to maximize assuming that the use case for the model is the selection of companies to invest. Investors have strong bias against losing money, and maximizing precision would minimize false positives.
The Confusion matrices were estimated with the selected threshold, and it was found that the minimum cash-over-cash ratios to be possible to break even would be in the order of 1.5 for Acquired companies and 2.5 for IPO companies. These multipliers are not totally out of line with expectations from typical investors in this space.
The IPO model had fewer companies on the train the data set. The IPO model could benefit of additional data including more IPO companies.
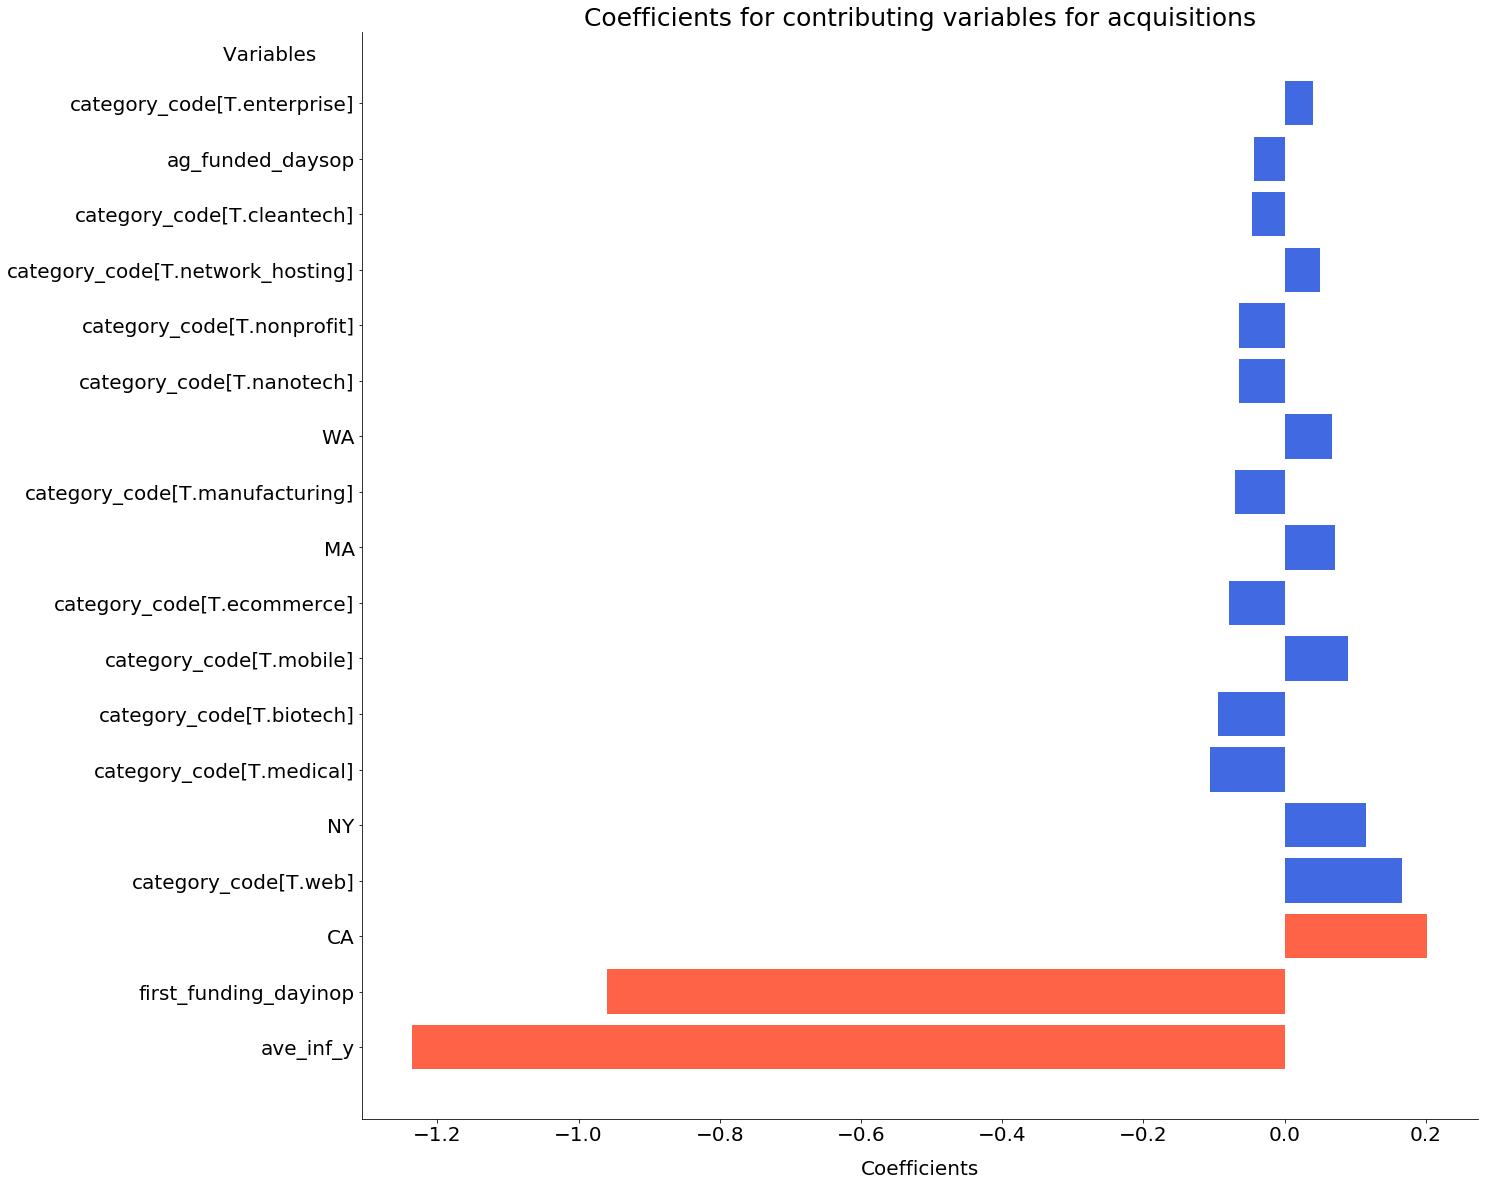
The features were normalized and the coefficients could be compared to evaluate the relative effect of the features on the company potential outcomes.
In both models, the feature with the greatest absolute coefficient is inflation at the time the company was founded. The highest the inflation the year the company was founded the less likely it would be acquired or go through an IPO.
In the case of acquisition, the longest it takes to raise founding for the first time the less likely the company will be acquired. Similarly, companies that are founded in CA, NY and which category is web are more likely to be acquired.

Conclusion: Models were developed to classify start-ups on either likely to be acquired or have an IPO, and their performance is better than the base.
Additional insights could be extracted from the model coefficients about the effect of the features on the company outcomes.
Future work: These models could be enhanced by including data from recent years. Crowdfunding has become more popular and it would be interesting to see the effect of crowdfunding on predicting company evolution.
In addition, more data would include more IPO companies, which would help train the IPO model further.